

An audiogram is a graphical representation of the hearing threshold, which is obtained in a hearing test and which provides insight into how a child hears different sounds.
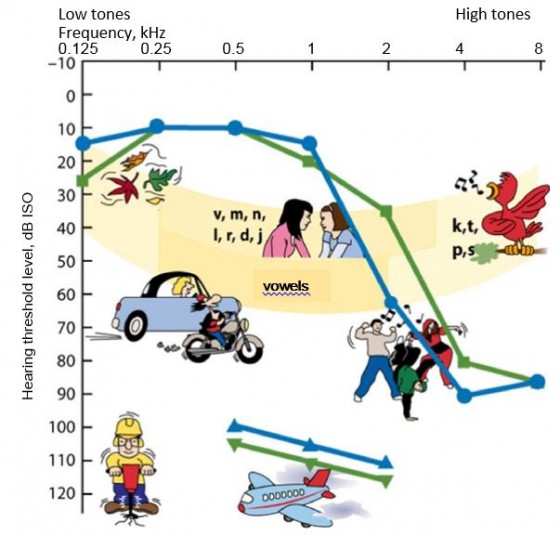
In the example above, various audio sources are presented on the basis of the frequency and intensity. A construction site drill makes a low and powerful sound. On the other hand, the sound of a bird singing is higher and less intense.
For understanding speech, the main frequencies are between 500–4000Hz and in the image, this speech area is illustrated by the yellow colour. This so-called “speech banana” presents the different frequencies of voice sounds, which gives an idea of what the impact is of hearing loss in speech understanding.
The example audiogram descends in the high frequencies, but is almost normal at the low frequencies. Without hearing aids a person does not, therefore, hear the birds singing or high consonants, but if the hearing aid can amplify the sound intensity enough, even these sounds can be heard.
The shorter curve that is visible further down presents the discomfort threshold, which describes the volume level at which point a sound is considered unpleasant. A normal ear can tolerate volume up to 115 dB, but hearing disabilities may also involve sensitisation to loud noises. The discomfort threshold is used in the adjustment of a hearing aid, in which case the confirmation provided by the hearing aid does not exceed it.

